Cloud & DevOpsAnalysis
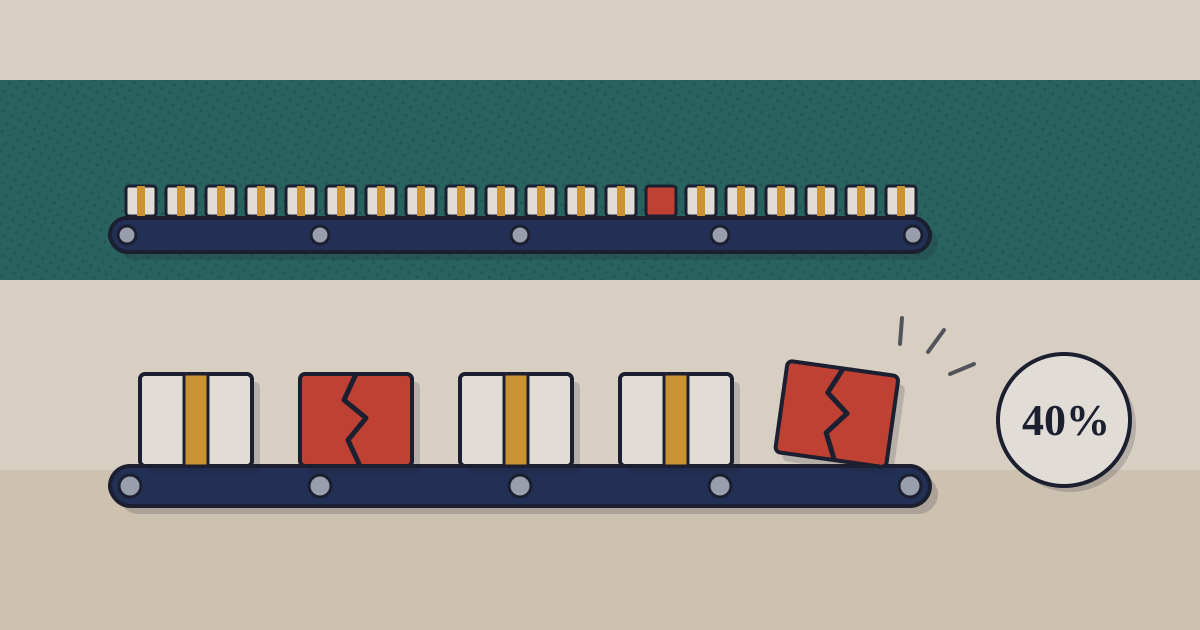
Low DevOps performers fail 40% of changes; elite teams fail 5%
What DORA's 2024 and 2025 reports measured on delivery, AI and platforms, and how 28 DevOps toolchain products bill, with Indian prices and rules, as of September 2026.

The 2023 version of this post listed four benefits, four challenges and four best practices, and supported them with five statistics: 46 times more deployments, a 200-fold faster turnaround, a 60% drop in failed releases, a 63% better chance of meeting goals, and a Gartner forecast for 2022. None carried a date or a link we could follow, so they are gone. The question a large Indian enterprise asks has not changed: is DevOps worth the disruption at our size, and what goes wrong when a company with legacy systems, a separate operations team and an audit function tries it? DORA, the research programme now run inside Google Cloud, has measured exactly this in an annual survey for years, and its numbers are more useful than any of the five.
01The benefit, measured: four numbers separate elite from low
DORA measures software delivery with four keys: how often a team deploys, how long a change takes from commit to production, what share of changes fail, and how fast the team recovers from a failed deployment. In its 2024 report, elite teams deploy on demand, take less than a day per change, fail 5% of changes and recover in under an hour. Low performers deploy between once a month and once every six months, take one to six months per change, fail 40% and take a week to a month to recover. Elite teams are under a fifth of organisations.1
Low performers' changes fail eight times as often as elite teams'; the middle is out of order
Change failure rate by DORA 2024 performance cluster, % of changes to production
Source: DORA, Accelerate State of DevOps 2024, cluster table as summarised by Octopus Deploy · as of 30 September 2026 · Clusters come from survey cluster analysis; thresholds move from year to year
The benefit the original promised, “faster time to market” with “quality improvement”, is therefore true only for the teams that get both. The four keys are cheap to measure from the systems a large enterprise already runs: the deployment log, the change calendar and the incident tool. Measure them before the programme starts, or you will never know which cluster you moved from.
Large enterprises usually find their lead time is set not by engineering but by approval. A change advisory board that meets weekly puts a floor of days under every change, however fast the pipeline is. The answer is not to abolish the board, which an auditor will ask about, but to move routine, tested, reversible changes to a standard-change path with automated evidence, and keep the board for the changes that genuinely need judgement. That is the original’s “organisational culture” challenge in a form a risk committee can sign.
02AI made developers feel faster and delivery less stable
In the 2024 report, more than 75% of respondents relied on AI for at least one daily task. DORA estimated that a 25% increase in AI adoption went with a 7.5% rise in documentation quality, 3.4% in code quality and 3.1% in code review speed, and with a 1.5% fall in delivery throughput and a 7.2% fall in delivery stability. 39% reported little or no trust in AI-generated code.2
In DORA's 2024 data, AI improved the code and cost the delivery
Estimated change associated with a 25% increase in AI adoption, DORA 2024 survey
What went up
- Documentation quality, +7.5%
- Code quality, +3.4%
- Code review speed, +3.1%
What went down
- Delivery stability, −7.2%
- Delivery throughput, −1.5%
Source: Google Cloud, Announcing the 2024 DORA report · as of 30 September 2026 · Associations from survey data, not causal
The 2025 report, published on 24 September 2025 from nearly 5,000 respondents, moved one of those lines. AI use reached 90%, more than 80% said it had raised their productivity, and the share with little or no trust in AI code fell to 30%. AI adoption now showed a positive relationship with throughput, but the relationship with delivery stability was still negative.3 DORA’s 2025 report frames AI as an amplifier of whatever a team already is: fast feedback and small batches get faster, weak testing and large batches break more often.
03Platforms: 90% have one, and the first year can cost performance
The original’s answer to scale was “start small” and “build a strong team”. DORA’s answer is the internal developer platform: a paved road of templates, pipelines and environments that product teams use on their own. In 2024 DORA found platforms raise developer productivity, are more common in larger organisations, and can bring a temporary dip in performance before the gains arrive; results depend on treating the platform as a product with its developers as users.2 By 2025, 90% of organisations had adopted at least one platform.3
Start with one value stream, a measured baseline and a platform run as a product
A rollout sequence for a large enterprise, built from DORA's 2024 and 2025 findings
- 01
Baseline one value stream
Pick one product line with a real release cadence. Record the four keys from the deployment log and incident tool.
- 02
Build the paved road
One pipeline template, one secrets store, one way to get an environment. A team owns it and treats developers as its users.
- 03
Gate AI on stability
Roll out the assistant where tests and review already catch defects; hold it where the change failure rate is rising.
- 04
Re-measure, then widen
Expect a dip in the first quarters. Add the next value stream only when the four keys have recovered.
Source: Google Cloud, 2024 and 2025 DORA report announcements; TechBag synthesis · as of 30 September 2026
Legacy systems, the original’s second challenge, belong in step one. A mainframe or a vendor-hosted core system with a monthly release window is a fixed constraint on the value stream. Measure it honestly and decouple around it, rather than counting it as a failure of the programme.
04The toolchain bill: three meters, and a quarter of products quote only
A DevOps programme buys a toolchain, and a large enterprise discovers the meters only at renewal. TechBag’s developer tools guide, last reviewed on 24 August 2026, lists 28 products by SKU across nine vendors: GitHub, GitLab, Atlassian, Postman, HashiCorp, JFrog, Sonar, Sonatype and Kong.4
Half of the DevOps toolchain prices per seat; a quarter will not quote until you call
Developer-tool SKUs by licence model, count, TechBag guide reviewed 24 August 2026
- Per seat14 SKUs 50%
- Consumption (resources, storage, calls)7 SKUs 25%
- Quote only7 SKUs 25%
Table view
| Value (SKUs) | Share | |
|---|---|---|
| Per seat | 14 | 50% |
| Consumption (resources, storage, calls) | 7 | 25% |
| Quote only | 7 | 25% |
Source: TechBag developer tools guide, 28 SKUs across 9 vendors; TechBag count · as of 30 September 2026
The meters matter because they move with the success of the programme. More deployments mean more CI minutes; more infrastructure as code means more managed resources on a per-resource meter; a wider AI rollout means more add-on seats. Budget the second year at the deployment rate you are aiming for, not the one you have.
The usual escape from the minutes meter is self-hosted runners: build machines you already own, registered with GitHub or GitLab, so the pipeline stops consuming metered minutes. The guide is blunt about the trade: they are infrastructure you now maintain and secure, and a compromised runner is a supply-chain problem, because it holds the credentials every deployment uses.4 For a large enterprise with a data centre and a security team that is often the right trade. For a business unit without either, the meter is cheaper than the incident.
Sources
- Octopus Deploy (Steve Fenton), The 2024 DevOps performance clusters, summarising DORA's Accelerate State of DevOps 2024 — 19 November 2024
- Google Cloud, Announcing the 2024 DORA report (AI adoption effects; platform engineering) — 23 October 2024
- Google Cloud, Announcing the 2025 DORA report: State of AI-assisted Software Development — 24 September 2025
- TechBag, Developer tools guide (28 SKUs, licence models, CI minutes, AI licensing, self-hosting, India region, Postman Team price) — reviewed 24 August 2026
- India Briefing, OIDAR services: GST and reverse charge — 29 September 2023
- CERT-In, Directions under section 70B(6) of the IT Act, 2000 (six-hour reporting; 180-day logs within India) — 28 April 2022
- SEBI, Cybersecurity and Cyber Resilience Framework (CSCRF) for SEBI Regulated Entities — 20 August 2024; in force 31 August 2025
- RBI, Cybersecurity, Technology Risk and Resilience Framework Directions, 2026, via practitioner summary — 31 July 2026 RBI PDF not fetched.
- Legismith Partners, DPDP Rules 2025 commencement timeline — Rules notified 13 November 2025
Related on TechBag: the developer tools guide carries the 28 SKUs counted here; the GitLab DevSecOps Platform page covers the single-platform option and its self-managed route; the observability guide covers the tools that measure recovery time.
Disclosure. TechBag is a software reseller: it earns a margin when a reader buys through it, including from vendors named here. The analysis is TechBag’s own; no vendor paid for or saw this piece before publication. Facts are labelled reported, TechBag count or our view.
Keep reading