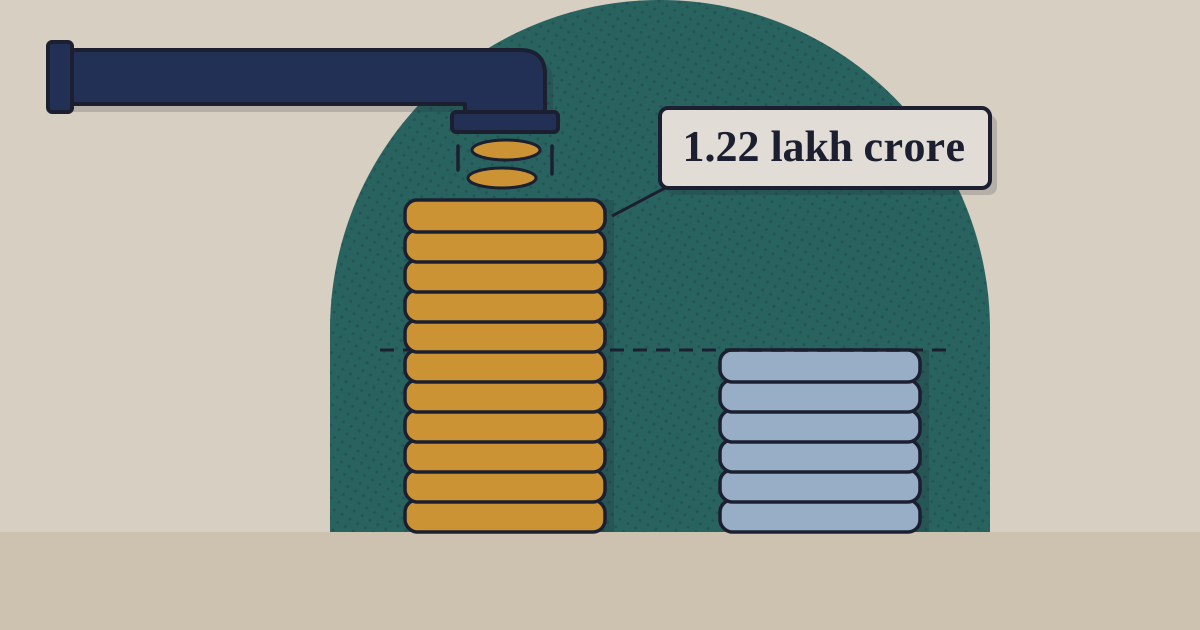
Foreign investors bought a record ₹1.22 lakh crore of Indian shares in November
NSDL’s data to 20 November: ₹1,22,265 crore of net equity buying, 1.85 times the previous record month, as Taiwan’s TAIEX fell 17.5% and the Nasdaq 10% in a week.

Every trade a foreign fund makes in India is reported by its custodian to the depositories, and NSDL publishes the net figure each working day. For most of 2026 the figure was negative. In November it turned into the largest month of foreign buying in the series. How big is it against every month since 2002, what does NSDL’s “equity” line count, and what did the market do?
01Ten months of selling, then the largest month on record
NSDL’s monthly table shows FPIs as net sellers of Indian equity in seven of the first ten months of 2026, including ₹1,17,775 crore in March, the largest selling month in the table, and ₹34,843 crore in October. 2025 ended with ₹1,66,286 crore of net selling.12 November reversed it: net buying in every one of NSDL’s 14 daily reports from 2 to 20 November, ₹1,22,265 crore in all, 41% of the ten-month outflow. For the year the net figure is now −₹1,72,880 crore.13
November's ₹1,22,265 crore followed ten months that netted ₹2,95,145 crore of selling
FPI net investment in Indian equity per month, ₹ crore, January 2025 to November 2026 (November to the report of 20 November)
₹ crore
Show tableHide table
| FPI net equity | |
|---|---|
| Jan 2025 | -78,027 |
| Feb 2025 | -34,574 |
| Mar 2025 | -3,973 |
| Apr 2025 | 4,223 |
| May 2025 | 19,860 |
| Jun 2025 | 14,590 |
| Jul 2025 | -17,741 |
| Aug 2025 | -34,993 |
| Sep 2025 | -23,885 |
| Oct 2025 | 14,610 |
| Nov 2025 | -3,765 |
| Dec 2025 | -22,611 |
| Jan 2026 | -35,962 |
| Feb 2026 | 22,615 |
| Mar 2026 | -1,17,775 |
| Apr 2026 | -60,847 |
| May 2026 | -32,963 |
| Jun 2026 | -49,340 |
| Jul 2026 | 20,200 |
| Aug 2026 | 29,631 |
| Sep 2026 | -35,861 |
| Oct 2026 | -34,843 |
| Nov 2026 | 1,22,265 |
Source: NSDL, Monthly FPI Net Investments (calendar year) · as of 20 November 2026 · months by NSDL reporting date; includes primary market
The buying was steady rather than one block. The largest report, of 6 November, carried ₹16,278 crore; the smallest, of 3 November, ₹3,352 crore. In the five reports of 16 to 20 November FPIs bought ₹37,974 crore.3 At the RBI reference rate of ₹92.9699 on 20 November the month’s total is about US$13.2bn; at the rate NSDL applies to each day it is US$13.0bn.311
02What the number counts
NSDL’s equity line has two parts. “Stock Exchange” is buying and selling of listed shares on the exchanges: ₹1,13,720 crore of November’s total, 93%. “Primary market & others” is shares bought directly from companies, such as allotments in public offers and qualified institutions placements: ₹8,545 crore, of which ₹5,351 crore came in the report of 18 November and ₹2,737 crore in that of 19 November.3 NSDL does not name the issues. Urban Company’s ₹2,500 crore placement, which closed on 19 November, is the kind of sale the line records when foreign funds take part.
Two more things to know before quoting the figure. Each report carries the previous trading day’s trades, so November in NSDL’s table runs from the trades of 30 October to those of 19 November, and Friday’s trades appear on Monday. And the figures come from custodians’ reports, so they differ from the provisional numbers the exchanges publish on the trading day itself.4
November is nearly twice the previous record month
The eight largest months of FPI net investment in Indian equity, ₹ crore, January 2002 to November 2026
Source: NSDL, Monthly FPI Net Investments (calendar year), every year 2002 to 2026; TechBag ranking · as of 20 November 2026 · November 2026 to the report of 20 November
03The week: Mumbai up, Taipei and New York down; what to watch
+2.61%
Nifty 50, to 25,800.60, week to 20 November
NSE
+5.90%
Nifty Bank, to 64,635.20
NSE
−17.5%
Taiwan’s TAIEX, to 36,033.29
TWSE
−10.0%
Nasdaq Composite, to 22,617.73
Nasdaq
From Friday 13 to Friday 20 November the Nifty 50 rose from 25,144.30 to 25,800.60 and the Bank Nifty from 61,034.10 to 64,635.20. India’s technology index went the other way: the Nifty IT fell 1.9% to 31,322.65.56 The Sensex rose 2.85% to 83,919.71.12 Since 30 October, the last trading day before November’s first report, the Nifty 50 is up 11.9% and the Bank Nifty 18.2%; the Nifty IT is down 3.9%.56 The Nifty is 2.0% below its record close of 26,328.55, set on 2 January.7
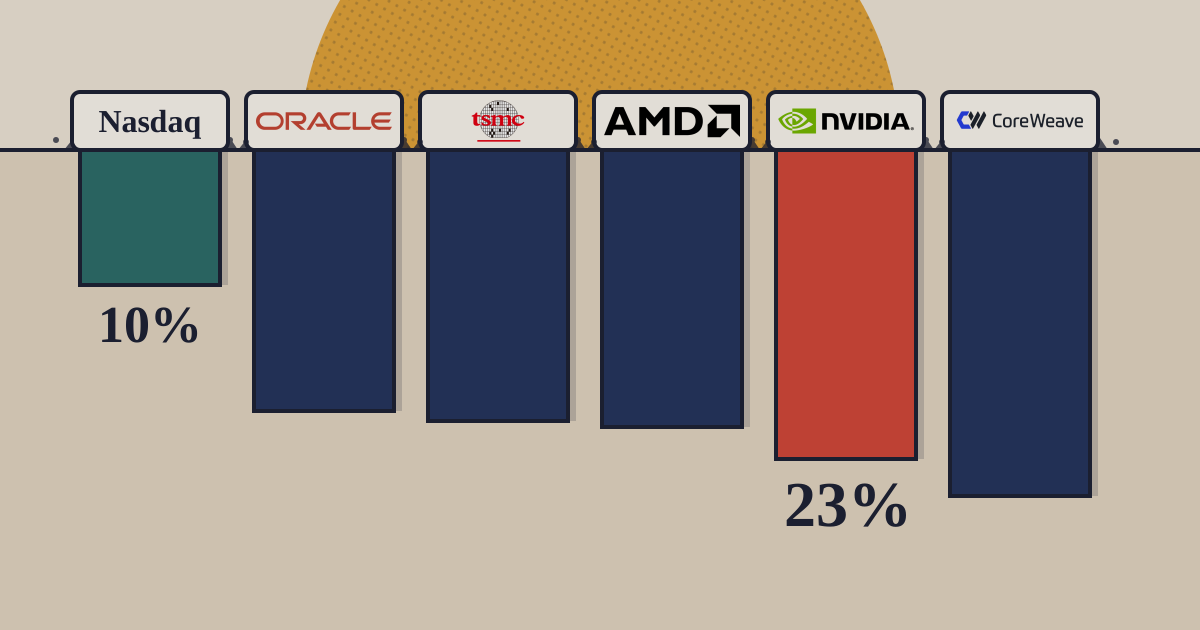
Elsewhere the same week brought steep falls. Taiwan’s TAIEX fell from 43,675.12 to 36,033.29, and foreign investors sold a net NT$218.67bn of Taiwanese shares from 16 to 20 November and NT$839.83bn in November so far, by the exchange’s figures.89 The Nasdaq Composite fell from 25,136.27 to 22,617.73.10 Our Taiwan Analysis and the week in AI stocks cover both falls. NSDL, SEBI and the RBI have published no explanation of November’s flows, and neither depository nor exchange data show whether the funds selling in Taipei are the ones buying in Mumbai. The timing matches the first week of the month, when the Nifty rose 8.58% as chip stocks fell.
What to watch.
- The rest of the month. NSDL’s reports of 23 to 30 November carry the trades of 20 to 27 November and settle November’s final figure.3
- The primary-market line. Placements and listings bought by foreign funds show up there, separate from exchange buying.3
- The Nifty’s record. It needs another 2.0% to pass 26,328.55.7
Sources
- NSDL, Monthly FPI Net Investments (calendar year 2026) — up to 20 November 2026
- NSDL, Monthly FPI Net Investments, calendar years 2002 to 2025 (same report, by year) — January 2002 to December 2025
- NSDL, Daily Trends in FPI Investments, November 2026 (reporting dates 2 to 20 November) — 20 November 2026
- NSDL, Daily Trends in FPI Investments on 20-Nov-2026 (latest report, with NSDL's note on confirmed and provisional data) — 20 November 2026
- NSE, daily index closing values (ind_close_all), 20 November 2026 — 20 November 2026
- NSE, daily index closing values (ind_close_all), 13 November and 30 October 2026 — 13 November 2026 30 October: nsearchives.nseindia.com/content/indices/ind_close_all_30102026.csv
- NSE, historical index data: Nifty 50 daily closes (record close of 2 January 2026) — 2 January to 20 November 2026
- Taiwan Stock Exchange, TAIEX historical data, November 2026 — 20 November 2026
- Taiwan Stock Exchange, trading value of foreign and other investors (BFI82U), week of 16 to 20 November and 1 to 20 November — 20 November 2026
- Nasdaq, Nasdaq Composite (COMP) historical data — 20 November 2026
- Reserve Bank of India, reference rate, INR per US dollar (source: FBIL) — 1pm, 20 November 2026
- Yahoo Finance, BSE Sensex (^BSESN) daily closes, 13 and 20 November 2026 (quote data, not a primary source) — 20 November 2026
Disclosure. TechBag is a software reseller: it earns when companies buy through it, including from vendors named here. The analysis is TechBag’s own; no vendor paid for or saw this piece before publication. Facts are labelled reported, TechBag count or our view.
Keep reading