GPU rent turned up: B200 hours rose 21% in a month, H100 hours 7%
Daily settled rental prices for Nvidia's B200, H200 and H100 from two public indices, 30 July to 30 October 2026, set against a year of posted-price medians.

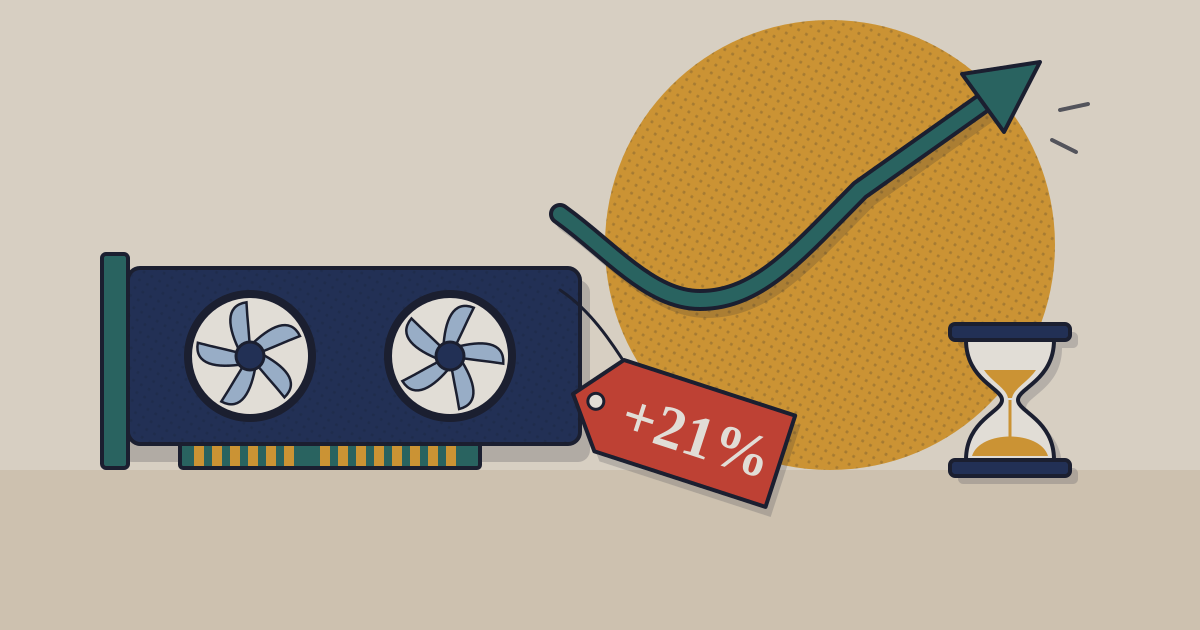
Renting an Nvidia B200 for an hour cost US$9.83 on 29 October on the Ornn Compute Price Index, which is built from executed trades rather than price lists. That was 20.8% more than on 29 September and 73% more than the index’s low of US$5.68 on 10 August.1 On the same day the H200 settled at US$5.96, up 20.6% on the month, the A100 at US$1.09, up 18.5%, and the H100 at US$2.92, up 6.6%.234 A second index, built from the on-demand prices that GPU clouds post, says renting a GPU “costs 41.7% more than it did on 10 August”.56 The direction used to be the other way. In June 2025 AWS cut the on-demand price of its H100 instances (P5) by 44%, saying “we work hard to lower our costs so that we can pass those savings back to our customers”.8
01The line: two months up, after a summer down
Ornn’s month-end settles show the shape. The B200 fell 5.3% in August, then rose 33.3% in September and 21.5% in October to 29 October. The H200 fell 21.4%, then rose 26.2% and 6.8%. The H100 has gone sideways: up 7.6% in August, down 8.8% in September, up 7.7% in October, inside a range of US$2.49 to US$3.57 since 30 July.123 Two monthly rises are a turn in the line, not yet an established trend, and Ornn’s free history starts on 30 July, so the same measure cannot be set against 2025.
The B200 rose from US$5.68 to US$9.83 an hour between 10 August and 29 October; the H100 barely moved
Ornn Compute Price Index, daily settle, US$ per GPU-hour, 30 July to 29 October 2026
- B200
- H200
- H100
US$ per GPU-hour
Table view
| B200 | H200 | H100 | |
|---|---|---|---|
| 30 Jul | 6.37 | 5.4 | 2.75 |
| 31 Jul | 6.41 | 5.62 | 2.76 |
| 1 Aug | 6.43 | 5.25 | 2.69 |
| 2 Aug | 6.33 | 4.82 | 2.6 |
| 3 Aug | 6.09 | 4.36 | 2.64 |
| 4 Aug | 5.96 | 4.54 | 2.68 |
| 5 Aug | 5.84 | 4.81 | 2.7 |
| 6 Aug | 5.75 | 4.92 | 2.72 |
| 7 Aug | 5.76 | 4.83 | 2.68 |
| 8 Aug | 5.73 | 4.56 | 2.66 |
| 9 Aug | 5.7 | 4.67 | 2.53 |
| 10 Aug | 5.68 | 4.67 | 2.56 |
| 11 Aug | 5.71 | 4.49 | 2.67 |
| 12 Aug | 5.72 | 4.51 | 2.72 |
| 13 Aug | 5.82 | 4.7 | 2.73 |
| 14 Aug | 6 | 4.86 | 2.79 |
| 15 Aug | 5.91 | 4.94 | 2.66 |
| 16 Aug | 5.93 | 4.75 | 2.64 |
| 17 Aug | 6.17 | 5 | 2.74 |
| 18 Aug | 6.6 | 5.11 | 3.04 |
| 19 Aug | 6.63 | 5.29 | 2.93 |
| 20 Aug | 6.87 | 5.44 | 2.9 |
| 21 Aug | 6.95 | 5.09 | 2.88 |
| 22 Aug | 6.74 | 4.85 | 2.68 |
| 23 Aug | 6.64 | 4.42 | 2.87 |
| 24 Aug | 6.55 | 4.33 | 3 |
| 25 Aug | 6.45 | 4.26 | 2.97 |
| 26 Aug | 6.22 | 4.24 | 2.68 |
| 27 Aug | 6.03 | 4.29 | 2.76 |
| 28 Aug | 6.01 | 4.49 | 2.93 |
| 29 Aug | 6.06 | 4.44 | 2.87 |
| 30 Aug | 6.05 | 4.5 | 3.01 |
| 31 Aug | 6.07 | 4.42 | 2.97 |
| 1 Sep | 6.4 | 4.51 | 2.83 |
| 2 Sep | 6.46 | 4.47 | 2.83 |
| 3 Sep | 6.28 | 4.59 | 2.92 |
| 4 Sep | 6.4 | 4.63 | 2.89 |
| 5 Sep | 6.42 | 4.55 | 3.06 |
| 6 Sep | 6.64 | 4.47 | 3.07 |
| 7 Sep | 6.75 | 4.56 | 3.17 |
| 8 Sep | 6.72 | 4.91 | 3.08 |
| 9 Sep | 6.82 | 4.91 | 2.96 |
| 10 Sep | 6.89 | 4.93 | 2.84 |
| 11 Sep | 6.84 | 5.12 | 2.87 |
| 12 Sep | 6.8 | 4.69 | 2.81 |
| 13 Sep | 7.06 | 4.38 | 2.78 |
| 14 Sep | 7.19 | 4.6 | 2.75 |
| 15 Sep | 7.21 | 4.68 | 2.53 |
| 16 Sep | 7.03 | 5.27 | 2.62 |
| 17 Sep | 7.1 | 5.16 | 2.85 |
| 18 Sep | 7.26 | 5.6 | 3.02 |
| 19 Sep | 7.43 | 5.13 | 2.85 |
| 20 Sep | 7.71 | 5.22 | 2.65 |
| 21 Sep | 7.71 | 5.07 | 2.79 |
| 22 Sep | 7.77 | 4.94 | 2.85 |
| 23 Sep | 7.95 | 5.02 | 3.05 |
| 24 Sep | 8.01 | 5.16 | 2.92 |
| 25 Sep | 8.04 | 5.08 | 2.85 |
| 26 Sep | 8.04 | 4.78 | 2.54 |
| 27 Sep | 8.08 | 4.62 | 2.49 |
| 28 Sep | 8.11 | 4.84 | 2.56 |
| 29 Sep | 8.14 | 4.94 | 2.74 |
| 30 Sep | 8.09 | 5.58 | 2.71 |
| 1 Oct | 7.96 | 5.96 | 2.92 |
| 2 Oct | 7.9 | 6.23 | 2.79 |
| 3 Oct | 7.81 | 6.05 | 2.64 |
| 4 Oct | 7.71 | 5.57 | 2.59 |
| 5 Oct | 7.55 | 5.23 | 2.52 |
| 6 Oct | 7.56 | 5.04 | 2.86 |
| 7 Oct | 7.56 | 5.29 | 2.85 |
| 8 Oct | 7.51 | 5.65 | 2.84 |
| 9 Oct | 7.46 | 5.7 | 2.79 |
| 10 Oct | 7.53 | 5.91 | 2.67 |
| 11 Oct | 7.45 | 5.61 | 2.65 |
| 12 Oct | 7.33 | 5.24 | 2.92 |
| 13 Oct | 7.83 | 5.51 | 3.17 |
| 14 Oct | 7.88 | 6.12 | 3.21 |
| 15 Oct | 7.92 | 6.51 | 3.13 |
| 16 Oct | 8.12 | 6.34 | 2.74 |
| 17 Oct | 8.48 | 6.39 | 2.78 |
| 18 Oct | 8.54 | 6.34 | 2.81 |
| 19 Oct | 8.41 | 6.35 | 2.98 |
| 20 Oct | 8.83 | 6.16 | 3.12 |
| 21 Oct | 9.4 | 5.88 | 3.09 |
| 22 Oct | 9.32 | 6.02 | 3.15 |
| 23 Oct | 9.58 | 5.74 | 3.17 |
| 24 Oct | 9.57 | 6.2 | 3.02 |
| 25 Oct | 9.7 | 6.3 | 3.03 |
| 26 Oct | 9.76 | 6.21 | 3.17 |
| 27 Oct | 9.66 | 6.42 | 3.57 |
| 28 Oct | 9.83 | 6.6 | 2.96 |
| 29 Oct | 9.83 | 5.96 | 2.92 |
Source: Ornn Data, OCPI-B200, OCPI-H200 and OCPI-H100 daily settles (volume-weighted, winsorized average of transacted rentals) · as of 29 October 2026 · Executed trades across neocloud providers, not list prices; settled 4pm New York time
Posted prices tell a longer story with a different turning point. GetDeploying’s weekly median of on-demand H100 prices across providers fell from US$2.98 at the end of October 2025 to US$2.49 in March 2026, then climbed from May to US$3.99 in late October.7
02What drives it, in the words of the people closest to it
The buyers of compute. On Alphabet’s results call on 28 October, Sundar Pichai said of Google Cloud: “there’s huge demand. We are working hard to bring more capacity online”. Google’s own model APIs were processing nearly 32 billion tokens a minute, 40% more than the previous quarter. Anat Ashkenazi, the chief financial officer, said that “given the supply-constraint environment, we started utilizing third-party compute capacity at the end of Q3 and will ramp usage in Q4”. Alphabet did not name the suppliers or the chips.9
The parts. SK hynix, which makes the high-bandwidth memory stacked on these GPUs (the B200 carries 180 GB of HBM3e), said on 28 October that it expects “the structure in which demand exceeds supply to persist through 2030”.101
The index publishers. Singularity Research, which republishes the posted-price series, reads it this way: “Rising rents, especially for older chips like the H100 and A100, mean demand still exceeds supply. Falling rents mean new capacity has caught up.”7
What does not fit. The newest chip moved the other way: the median posted price of a B300 fell 16.3% over the 30 days to 30 October.5 And what labs charge per token kept falling on Ornn’s blended token indices, 41.6% for Anthropic and 48.9% for OpenAI over the month. A blend moves when buyers shift between models, so that is not the same as a price cut.4
03What it means for a company buying GPU time or AI services
A budget built on 2025’s falling prices is two months out of date for the B200 and H200; for the H100, traded prices are roughly where they were in July. The gap between what sellers post and what buyers pay is wide. Ornn found posted on-demand H100 rates at four GPU clouds 19.5% to 111% above its 29 October settle (rates read on 6 October).2 On 30 October the same H100 SXM was listed from US$1.99 to US$11.68 an hour across providers.5
The price of a commitment has also moved. A year ago a 12-month H100 reservation listed at US$3.06 an hour, slightly above the on-demand median of US$2.98. On 26 October it listed at US$3.26 against US$3.99 on demand, 18% lower.7
On-demand H100 prices rose 60% from March's low, while 12-month reservations rose less
Weekly median posted price across providers, NVIDIA H100, US$ per GPU-hour, 27 October 2025 to 26 October 2026
- On-demand
- Reserved 1 yr
US$ per GPU-hour
Table view
| On-demand | Reserved 1 yr | |
|---|---|---|
| 27 Oct 25 | 2.98 | 3.06 |
| 3 Nov 25 | 2.98 | 3.06 |
| 10 Nov 25 | 2.95 | 3.47 |
| 17 Nov 25 | 2.95 | 3.06 |
| 24 Nov 25 | 2.89 | 3.08 |
| 1 Dec 25 | 2.89 | 3.08 |
| 8 Dec 25 | 2.89 | 3.08 |
| 15 Dec 25 | 2.81 | 3.08 |
| 22 Dec 25 | 2.81 | 3.08 |
| 29 Dec 25 | 2.73 | 3.08 |
| 5 Jan 26 | 2.73 | 3.08 |
| 12 Jan 26 | 2.69 | 2.66 |
| 19 Jan 26 | 2.89 | 2.69 |
| 26 Jan 26 | 2.89 | 2.69 |
| 2 Feb 26 | 2.94 | 4.45 |
| 9 Feb 26 | 2.94 | 4.45 |
| 16 Feb 26 | 2.87 | 4.45 |
| 23 Feb 26 | 2.53 | 2.64 |
| 2 Mar 26 | 2.49 | 2.69 |
| 9 Mar 26 | 2.49 | 2.62 |
| 16 Mar 26 | 2.49 | 2.61 |
| 23 Mar 26 | 2.49 | 2.53 |
| 30 Mar 26 | 2.5 | 2.54 |
| 6 Apr 26 | 2.49 | 2.54 |
| 13 Apr 26 | 2.5 | 2.54 |
| 20 Apr 26 | 2.59 | 2.6 |
| 27 Apr 26 | 2.5 | 2.58 |
| 4 May 26 | 2.59 | 2.58 |
| 11 May 26 | 2.64 | 2.59 |
| 18 May 26 | 2.86 | 3.47 |
| 25 May 26 | 2.8 | 2.8 |
| 1 Jun 26 | 2.94 | 2.8 |
| 8 Jun 26 | 2.76 | 2.8 |
| 15 Jun 26 | 2.8 | 2.8 |
| 22 Jun 26 | 2.73 | 2.8 |
| 29 Jun 26 | 2.87 | 2.71 |
| 6 Jul 26 | 2.99 | 2.71 |
| 13 Jul 26 | 2.89 | 2.71 |
| 20 Jul 26 | 2.99 | 2.79 |
| 27 Jul 26 | 3.11 | 3.02 |
| 3 Aug 26 | 3.25 | 3.05 |
| 10 Aug 26 | 3.29 | 3.02 |
| 17 Aug 26 | 3.25 | 3.08 |
| 24 Aug 26 | 3.2 | 3.06 |
| 31 Aug 26 | 3.14 | 3.15 |
| 7 Sep 26 | 3.2 | 3.28 |
| 14 Sep 26 | 3.15 | 3.15 |
| 21 Sep 26 | 3.23 | 3.24 |
| 28 Sep 26 | 3.32 | 3.26 |
| 5 Oct 26 | 3.41 | 3.21 |
| 12 Oct 26 | 3.8 | 3.23 |
| 19 Oct 26 | 3.99 | 3.26 |
| 26 Oct 26 | 3.99 | 3.26 |
Source: GetDeploying, GPU rental price history (CC BY 4.0), as published by Singularity Research · as of 26 October 2026 · Posted prices, not trades: the median across listed providers each week
Buying the output instead of the hours does not escape the question. Google’s Gemini API price page, updated on 28 October, doubles Gemini 4 Argon from US$2 to US$4 per million input tokens and from US$10 to US$20 per million output tokens on 1 December, and Gemini 3.8 Flash from US$0.75 and US$3.75 to US$1.50 and US$7.50 on 1 January 2027. The page gives no reason.11
What to watch. Ornn settles every trading day at 4pm New York time. The settle on 30 October closes the month, and the settle on 30 November will show whether the B200 makes three months of rises in a row or the H100 breaks out of its range.1 Google’s Argon price rise takes effect on 1 December.11 We will refresh this line in mid-November.
Sources
- Ornn Data, NVIDIA B200 Price Index (OCPI-B200, Bloomberg ORNNB200): daily settles, month-end table and methodology summary — settled 29 October 2026
- Ornn Data, NVIDIA H100 SXM Price Index (OCPI-H100, Bloomberg ORNNH100), with posted on-demand rates at four GPU clouds read on 6 October 2026 — settled 29 October 2026
- Ornn Data, NVIDIA H200 Price Index (OCPI-H200) — settled 29 October 2026
- Ornn Data, GPU Market Prices and Token Price Index overview (A100 SXM4; Anthropic and OpenAI blended token indices) — settled 29 October 2026
- Price of Compute, Price of Compute Index and live on-demand prices by GPU — 30 October 2026, 08:36 UTC
- Price of Compute, Methodology & About (16 providers, two-stage median, index basket of six SKUs, base 10 August 2026) — undated page
- Singularity Research, GPU rental prices: live and since 2023 (GetDeploying weekly medians, CC BY 4.0; Price of Compute daily index) — 30 October 2026; weekly series to 26 October 2026
- AWS News Blog, Channy Yun: Announcing up to 45% price reduction for Amazon EC2 NVIDIA GPU-accelerated instances — 5 June 2025
- Alphabet, Q3 2026 earnings call transcript — 28 October 2026
- SK hynix Newsroom: SK hynix Announces 3Q26 Financial Results — 28 October 2026
- Google AI for Developers, Gemini Developer API pricing — last updated 28 October 2026
- PIB, Democratising AI in India: Expanding Access to AI Resources, Skills, and Technology Nationwide — 10 February 2026
- PIB, India AI Stack: Powering Intelligence at Scale — 4 February 2026
Related on TechBag: the Google Cloud page, the Microsoft Azure page, and how AI agents are billed.
Disclosure. TechBag is a software reseller: it earns a margin when a reader buys through it, including from vendors named here. The analysis is TechBag’s own; no vendor paid for or saw this piece before publication. Facts are labelled reported, TechBag count or our view.
Keep reading