Applied Materials’ revenue rose 53%; DRAM tool sales nearly doubled, Taiwan passed China
Applied Materials’ results for the quarter to 25 October: US$10.41bn of revenue, equipment sales by memory and logic, sales by country, and a US$11.1bn guide for the next quarter.

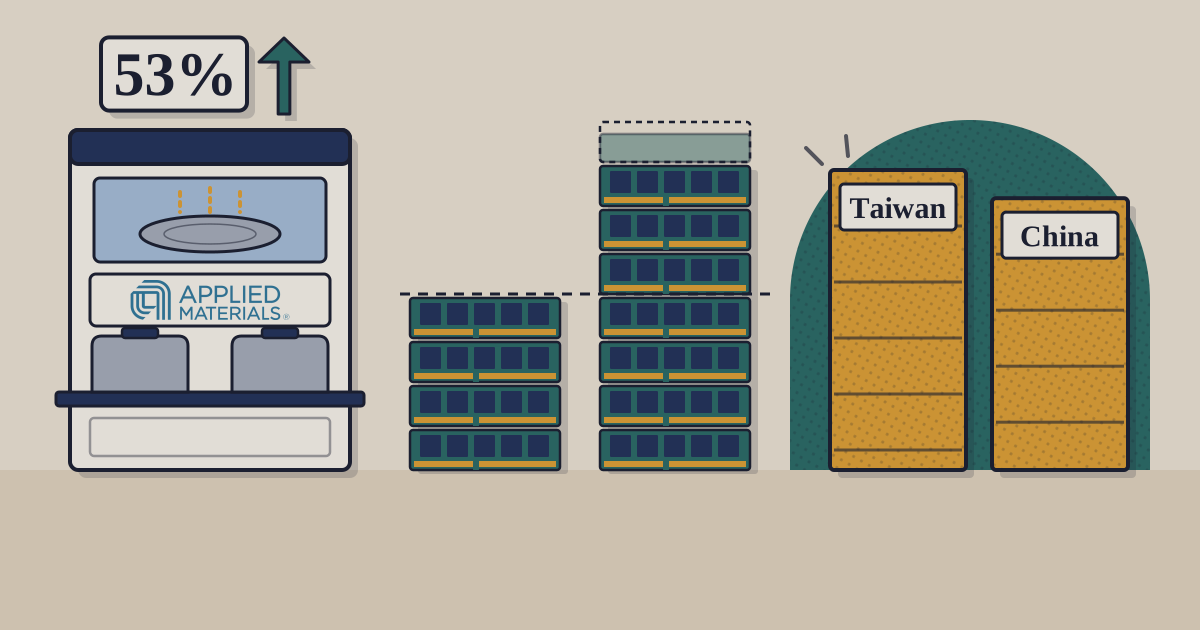
Applied Materials’ revenue rose 53%, to a record US$10.41bn, in the quarter to 25 October. Its chip-making equipment business, which sells the machines that deposit, etch, implant and measure the layers on silicon wafers, took US$8.0bn, up 64%.1 Within that, sales to makers of DRAM, the working memory in servers, PCs and phones, nearly doubled: DRAM was 33% of equipment revenue, against 28% a year earlier, which puts it at about US$2.64bn, up about 93%. Taiwan, at 28% of revenue, passed China, at 25% (29% a year earlier), as the company’s largest market.1
US$10.41bn
revenue in the quarter to 25 October, up 53%
Applied Materials
+93%
DRAM equipment sales, to about US$2.64bn
TechBag count
28%
of revenue from Taiwan, against 25% from China
Applied Materials
US$11.1bn
revenue guided for the next quarter, plus or minus US$0.5bn
Applied Materials
01What the machines went into
Foundry and logic, the chips made by contract manufacturers and processor makers, fell to 58% of equipment revenue from 66%, but still grew, to about US$4.64bn from US$3.22bn. Flash memory rose to 9% from 6%, about US$0.72bn. Applied Global Services, which sells spare parts, upgrades and service for machines already in fabs, grew 26%, to US$1.90bn.1 Gary Dickerson, the chief executive, said Applied is “on track to grow our Semiconductor Systems business more than 40 percent in our calendar 2026”, the four quarters to January 2027.1
02Where it was sold
Taiwan passed China as Applied’s largest market in August–October
Applied Materials revenue by customer location, US$ million, five quarters to October 2026
- Taiwan
- China
- Korea
- Other
Show tableHide table
| Taiwan | China | Korea | Other | |
|---|---|---|---|---|
| Aug–Oct 2025 | 1,834 | 1,964 | 1,219 | 1,783 |
| Nov 2025–Jan 2026 | 1,722 | 2,095 | 1,458 | 1,737 |
| Feb–Apr 2026 | 2,155 | 2,087 | 1,572 | 2,096 |
| May–Jul 2026 | 2,025 | 2,506 | 1,521 | 3,063 |
| Aug–Oct 2026 | 2,916 | 2,642 | 1,811 | 3,040 |
Source: Applied Materials quarterly results (Exhibit 99.1 to Form 8-K), November 2025 to November 2026 · as of 12 November 2026 · Other: the US, Japan, Europe and Southeast Asia
Sales to Taiwan rose 59% on a year earlier, to US$2.92bn; to China 35%, to US$2.64bn; to Korea 49%, to US$1.81bn. Sales to the United States doubled, to US$1.32bn. Over the full fiscal year China stayed the largest market, at 27% of revenue against Taiwan’s 26%.1 Taiwan has led before: in February–April it edged China, US$2.16bn to US$2.09bn.4 The release does not explain the shift. The year’s GAAP results include a US$253m charge for a settlement with the US Commerce Department’s Bureau of Industry and Security “to resolve a previously disclosed export controls compliance matter”, which Applied leaves out of its non-GAAP figures.1 How Taiwan’s largest chip maker’s own sales moved is in our Trend on TSMC and five server assemblers.
For November to January Applied guides revenue to US$11.1bn, plus or minus US$0.5bn, and non-GAAP earnings per share to US$4.35, plus or minus US$0.20.1 At the midpoint that is 58% above the US$7.01bn of a year earlier.2 Applied’s shares closed at US$380.95 on 12 November, down 3.58%, before the results reached the SEC at 4:02pm New York time; they stood at US$383.83 at 8pm after hours, and at US$375.26 at 9:28am on 13 November (7:58pm IST), before the open, down 1.5%.5 What to watch: whether DRAM holds above 30% of equipment sales, and the regional mix. China’s share has moved between 25% and 30% over these five quarters, Taiwan’s between 22% and 28%.63
Sources
- Applied Materials: fourth quarter and fiscal year 2026 results (Exhibit 99.1 to Form 8-K) — 12 November 2026
- Applied Materials: first quarter fiscal 2026 results (Exhibit 99.1 to Form 8-K) — 12 February 2026
- Applied Materials: third quarter fiscal 2026 results (Exhibit 99.1 to Form 8-K) — 13 August 2026
- Applied Materials: second quarter fiscal 2026 results (Exhibit 99.1 to Form 8-K) — 14 May 2026
- Nasdaq: Applied Materials (AMAT) after-hours and pre-market trading — 13 November 2026
- Applied Materials: fourth quarter and fiscal year 2025 results (Exhibit 99.1 to Form 8-K) — 13 November 2025
Disclosure. TechBag is a software reseller: it earns when companies buy through it, including from vendors named here. The analysis is TechBag’s own; no vendor paid for or saw this piece before publication. Facts are labelled reported, TechBag count or our view.
Keep reading