Buying software in IndiaAnalysis
Enterprise software ROI leaks in 3 places: 56% value gap, 46% idle seats
Where enterprise software returns are lost, measured: McKinsey and Oxford's 5,400 projects, Zylo's 2026 idle-seat data and Microsoft's 1 July 2026 price rise, as of September 2026.

The 2023 version of this post gave six best practices (define goals, drive adoption, customise, integrate, maintain, measure) and opened with five statistics attributed to Gartner, Forrester, TechRepublic, Panorama and McKinsey. We could not find a dated report behind any of the five, so they are gone. The question underneath was a good one, though, and an Indian CIO or CFO still asks it every budget cycle: once the contract is signed, where does the money go missing, and which of those leaks can a buyer close with a purchase order rather than a transformation programme? We call the answer the build, use, renew test, and each leak has a number.
01Build: large projects deliver 56% less value than planned
The most cited measurement of IT project outcomes is still McKinsey’s work with the BT Centre for Major Programme Management at the University of Oxford, which examined more than 5,400 IT projects. On average, large IT projects, defined as those with an initial price tag above US$15 million, ran 45% over budget and 7% over time while delivering 56% less value than predicted. Seventeen per cent went so badly that they could threaten the existence of the company.1
The overrun gets the attention, but the bigger miss is value: 44 of every 100 units promised arrived
Average value delivered by large IT projects (initial budget above US$15 million), per 100 predicted, study published 2012
44%
Value delivered, per 100 predicted
while cost ran 45% over budget and time 7% over schedule
Source: McKinsey and the BT Centre for Major Programme Management, University of Oxford; more than 5,400 IT projects · as of 30 September 2026 · Large projects only; a mid-sized SaaS rollout is not this population. 44 is 100 minus the study's 56% shortfall
That is the original’s first practice, “identify and define business goals”, made testable. Before the purchase order, write down three numbers the software must move (days to close the books, tickets per agent, hours to onboard a joiner), the current value of each, and the date you will measure again. A goal without a baseline cannot be missed, which is why it so often is.
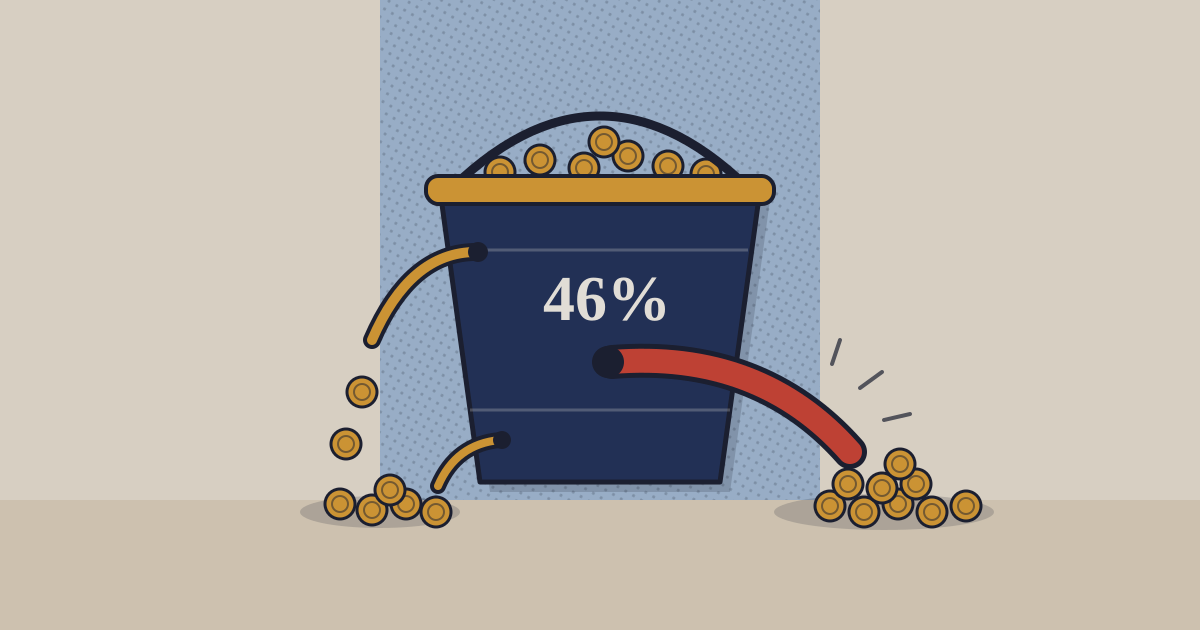
02Use: 46 of every 100 licences sit idle
Zylo’s 2026 SaaS Management Index, drawn from the portfolios Zylo manages for its customers, finds that the average organisation uses 54% of its SaaS licences and wastes US$19.8 million a year on unused licences alone. The waste scales with size: US$3.8 million at companies of up to 500 staff, US$9.5 million at 501 to 2,500, US$29.8 million at 2,501 to 10,000 and US$80.6 million above 10,000.2
Even a company of under 500 staff carries US$3.8 million a year of unused licences
Average annual spend on unused SaaS licences by company size, US$ million, Zylo 2026 index
Source: Zylo, How much is wasted on SaaS spend, citing the 2026 SaaS Management Index · as of 30 September 2026 · Zylo customers' portfolios, not a census; Zylo sells SaaS management software
The firm that measures the disease sells the cure, so read the figure as reported, not counted. But the direction matches what every admin console shows when someone finally looks: seats assigned to leavers, licences bought for a project that ended, premium tiers given to people who use the basic features. The original’s “ensure user adoption” is half of the fix. The other half is removing the seat when adoption does not happen.
03Renew: prices rose whether or not the seats were used
Vertice’s SaaS inflation tracker, built on the spend it processes for customers, recorded a record 16.4% rise in SaaS prices in June 2026, easing to 12.9% in July and 12.7% in August.3 The best documented single case is Microsoft’s. On 16 February 2026 it announced list-price changes effective 1 July 2026: Microsoft 365 E3 with Teams from US$36 to US$39 a user a month, E5 from US$57 to US$60, Office 365 E3 from US$23 to US$26, Business Basic from US$6 to US$7 and Business Standard from US$12.50 to US$14. Business Premium stayed at US$22, and the frontline F1 and F3 seats rose the most.4
Microsoft's 1 July 2026 rise was steepest on the cheapest seats and zero on Business Premium
US list price per user per month, with Teams, before and after 1 July 2026, US$; change in %
- Before 1 July 2026
- From 1 July 2026
Table view
| Before 1 July 2026 | From 1 July 2026 | Change | |
|---|---|---|---|
| Microsoft 365 F1 | 2.25 | 3 | 33% |
| Microsoft 365 F3 | 8 | 10 | 25% |
| Business Basic | 6 | 7 | 17% |
| Office 365 E3 | 23 | 26 | 13% |
| Business Standard | 12.5 | 14 | 12% |
| Microsoft 365 E3 | 36 | 39 | 8% |
| Microsoft 365 E5 | 57 | 60 | 5% |
| Business Premium | 22 | 22 | 0% |
Source: Microsoft, 2026 Microsoft 365 packaging and pricing updates (16 February 2026); TechBag arithmetic · as of 30 September 2026 · US list prices; country price lists, including India's, may differ
The pattern is a business model, not an accident. A flat Business Premium beside a 16.7% rise on Business Basic and 12% on Business Standard makes the security bundle look cheap at the moment of renewal. That may be the right move for you; it should be a decision, not a default. The original’s practices stopped at go-live. Renewal is where the third leak sits, and it has a date you already know.
04One 500-seat estate, worked in rupees
Put the three leaks on one bill. Take 500 users on Microsoft 365 E3 with Teams for a year, at US list and the ₹83 to the dollar TechBag’s buying guides use.
At Zylo's utilisation, idle seats cost six times what the July price rise added
500 Microsoft 365 E3 seats for a year at US list after 1 July 2026, ₹ lakh at ₹83 to the dollar
Source: Microsoft price list (16 February 2026); Zylo 2026 index utilisation; TechBag arithmetic · as of 30 September 2026 · Illustrative: assumes Zylo's average utilisation applies; Indian price lists and negotiated discounts differ
The order of the bars is the order of the work. Negotiating a few points off the rise is worth less than finding the idle seats, and both are worth less than the value question in section one if the software is not moving the number it was bought for. The original’s “customise” advice deserves a caution here too: every customisation is a cost at each upgrade and an argument against switching at renewal, so customise only where the baseline number demands it.
The original’s last practice, “measure performance”, becomes a calendar. For every contract above a few lakh a year:
- At signature, record the renewal date, the notice period and the price-increase clause in one register, next to the three baseline numbers from section one. A renewal that auto-extends because nobody saw the notice date is the most expensive line in the register.
- Ninety days before renewal, pull last-login data and the tier each user actually needs. Remove idle seats, move light users to a lighter SKU where the licence terms allow it, and ask the vendor for the new price in writing.
- Sixty days before, re-measure the three numbers. If the software has not moved them, the conversation is about whether to renew at all, not about the discount.
- At renewal, sign for the seats you counted, not the seats you had, and put the data-handling terms in the same order form.
None of this needs a new tool for an estate of a handful of large contracts. A SaaS management platform starts to pay when the application count runs into the hundreds and nobody can say who bought what; below that, an owner per contract and a shared register do the job.
Sources
- McKinsey, Delivering large-scale IT projects on time, on budget, and on value (with the BT Centre for Major Programme Management, University of Oxford) — October 2012
- Zylo, How much is wasted on SaaS spend (54% of licences used; US$19.8 million average waste; waste by company size; 2026 SaaS Management Index) — updated 19 March 2026 Zylo sells a SaaS management platform.
- Vertice, SaaS inflation rate tracker (16.4% June, 12.9% July, 12.7% August 2026) — data to August 2026 Vertice sells SaaS procurement services.
- Microsoft, 2026 Microsoft 365 packaging and pricing updates (effective 1 July 2026) — 16 February 2026
- India Briefing, OIDAR services: GST and reverse charge — 29 September 2023
- CBIC, CGST Act 2017, section 16 (input tax credit) — 12 April 2017
- Legismith Partners, DPDP Rules 2025 commencement timeline — Rules notified 13 November 2025
- CERT-In, Directions under section 70B(6) of the IT Act, 2000 (180-day logs within India) — 28 April 2022
- RBI, Cybersecurity, Technology Risk and Resilience Framework Directions, 2026, via practitioner summary — 31 July 2026 RBI PDF not fetched.
Related on TechBag: the Microsoft 365 page sets out the Business and Enterprise plans; the Matrix42 SaaS Management page covers the tools that count idle seats; the ITSM and service desk guide shows which platforms keep the asset register in the same tool.
Disclosure. TechBag is a software reseller: it earns a margin when a reader buys through it, including from vendors named here. The analysis is TechBag’s own; no vendor paid for or saw this piece before publication. Facts are labelled reported, TechBag count or our view.
Keep reading